Google analytics is a powerful tool, and once you’ve had a chance to learn its main functions, it can be reasonably straightforward to use. What’s more, it can provide actionable insights that you can use to improve the user experience of your website (and ultimately boost conversion rate to attract more customers). For example, if you want to measure traffic, it tells you how many visits your website receives. If you’re interested in referral sources, Google breaks them down and spits out a nice pie chart to help with your analysis.
If you’re slightly more advanced, you can start creating goal funnels to measure conversions and really look at which parts of your website are performing well… and which are not. This functionality is very important. Most marketing departments will be set KPIs associated with many of these metrics, but yet many marketers are still confused about their value and what they really mean. How can they help businesses meet their goals and objectives (attract prospects, convert them to customers and grow revenues)? And how can you make the most out of this amazing tool to support these efforts?
How to make the most of your Google Analytics data
I have managed hundreds of Google Analytics accounts and the most frequent issue I tend to uncover when inheriting an account include:
- The incorrect use of tracking codes
- A disconnect between the business' goals and the KPIs put in place
- Users attempting to analyse reports without using custom data and advanced segmentation
- Conversions and ecommerce performance being accredited to the wrong channels (or worse, you’re not able to figure out which of your channels is the most effective at all!)
Any of this sound familiar? If so, we’ve put together a few tips to help ensure this doesn’t happen to you.
1. Set business objectives first
If you want to see how your web analytics can improve your marketing, you need to have a goal in mind. Google Analytics will provide you with a lot of data, such as traffic volume, how your individual digital channels perform, where people are coming from, what language they speak, what country they live in and so much more. Although this data is great and allows you to tailor messaging, shape personas and focus your efforts in those areas likely to offer the most return, it’s not cost effective to constantly monitor. Therefore, make sure you have pre-set goals to measure against (e.g. I want to increase visitors to my product pages by 20% in 6 months, which I will track). This will allow you to set up dashboards and goals in Google Analytics specifically aligned to your business goals.
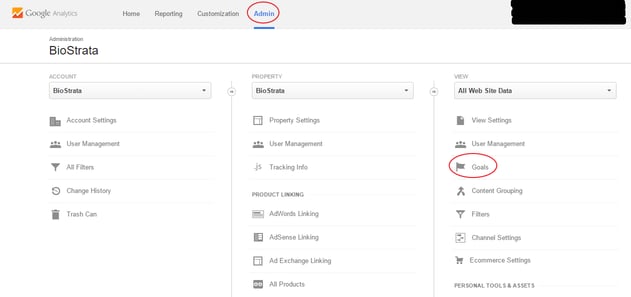
2. Create the related goal within Google Analytics
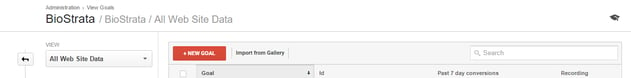
Now that you've set yourself a business objective, you need to set Google Analytics to track this as a goal. This will tell you how you are performing without having to review numerous data sources. To set up a goal, click on the ‘goal’ tab and select ‘new goal’.
From here you can either create a custom goal or select a goal from an existing template.
The templates library will contain a goal for this type of activity (since it's common), but if you were to set up a brand new goal, give it a name (e.g. product page views), set a type (e.g. pages viewed per session) and finally set a value (e.g. 2000 per month). Finally, by clicking on ‘verify’, Google Analytics will tell you how viable this is by reviewing your website's data from the past 7 days.
3. Create dashboards to monitor your progress
Customisable dashboards place your most interesting metrics front and centre. Most people become overwhelmed when visiting Google Analytics for the first time because of the sheer amount of data available. A dashboard is a quick and easy way to review data vital to your business objectives. Simply go to the dashboard tab, select create new and start populating the blank page with widgets. If you want to track visits to your product page, include the pages tab under behaviour overview to see how the page is ranking. For information on unique vs returning visitors, the pages referral source tab shows you where visitors are landing from, and the behaviour flow tab shows how people are reacting once on your site. All of this information can help you track your ultimate goal of attracting more visits to product pages, without having to view multiple areas of the analytics dashboard.
4. Create advanced segments
Now the dashboard and goals have been set up, it’s time to look at advanced segmentation. To create an advanced segment click on the dropdown and click ‘create new’. Now we are able to track traffic from all inbound links more accurately by simply entering the domain where your link is featured (e.g. an online ad, third party blogs etc.). You can see all traffic and goal conversion data that arrives from these sources, which provides a better overview of which channels are working best for your product page. It may turn out that the online ads are providing 100 unique visits a month whilst the specific blog provides over 1000. In this case, you might consider pausing the ads and investing more in distributing content and samples to third party bloggers writing about your products (and driving traffic to your site), especially if more of these visitors are converting into customers.
5. Set up interests and demographic data
Although this isn’t vital to the success of preliminary campaigns, it can provide huge value for future campaigns. It’s one of the only features that doesn’t start automatically when using Google Analytics for the first time and setting it up now will keep you a step ahead. All you need to do is navigate to the audience tab. Select ‘demographics’ and ‘overview’, and click ‘enable’. Now you can review all demographic data about your customers, most importantly, their spending habits. That’s right, if people spend money on your website using your ecommerce platform, Google can often tell us where they live, how old they are, what they’re interested in, what technology they own and how much they spend. This provides fantastic insight that can also be applied to your wider marketing mix.
If it turns out your audience are of a certain age, in a certain location and they all own smartphones and love technology, maybe it’s time to reconsider your sales materials. These customers are likely to respond to digital marketing, so you could consider transitioning print based materials over to a tablet. Image: Pressmaster/Shutterstock.com
Turning Google Analytics data into actionable insights
Now that your Analytics account has been properly configured, it’s much easier to interpret the valuable data being delivered. However, this is only the first step in the challenge. The second step is doing an in-depth analysis to figure out what is and isn’t working on your site, so you can make optimisations to increase visitor numbers, boost conversion rates, reduce bounce rates etc.
The good news is because of the configuration above, the hard part is done. For example, if Google is telling you that your product page receives no visits from banner ads and lots of visits from online articles, then this is a great opportunity to review both these materials. If Google tells you that your product page isn’t receiving any traffic from organic search, review the page's meta description and the on-page SEO, and start tailoring keywords. For tips on how to maximise your SEO, check out our SEO cheat sheet. If Google tells you that people arriving from email campaigns immediately navigate to the product page, place the CTA on your email campaigns click through direct to your product page. Finally Google tells you that the majority of your visitors are 65 years old, live in the north of France and have a background in engineering. How will this affect the hierarchy of your messaging? It’s probably time to start placing your engineering buyer persona at the top of your priority list.
Want more great content like this?