The ultimate aim of most businesses is to grow their customer base, and a good place to start is by increasing website traffic. You’ve probably all heard at some point or another that one of the best ways to do this is by demonstrating your knowledge through content marketing. And that distributing your content on social media channels can be a great way to capture and engage an audience.
Well, we’re big believers in content marketing and we’ve always been active across channels such as LinkedIn, Twitter, Facebook and Google+. However, we recently decided to scale up social media efforts during the month of June and closely track the results to see if we could increase performance. We love running these type of tests on our own marketing efforts – if they work out, we recommend them to clients. If they don’t, well, at least we learned something!
In this post we discuss what happened when we quadrupled our social media output (which was easier than it sounds) and the impact it had on our metrics. While we hoped to see an increase in performance, there are never any guarantees, so we wanted to test our hypothesis. We were also interested to see just how much of an impact increasing post frequency could have… Read on to see what we found out.
How we quadrupled our social media output without putting in much additional work
While the thought of quadrupling social media posts sounds like hard work, truth is, we were able to do it without committing more than around 1-2 hours extra per week. The first thing we did to increase post frequency involved scouring the web and tracking down science stories to share. While this wasn’t promoting our own content, it was an opportunity to interact with others in our industry, build connections with influencers and position ourselves as a source of valuable and interesting information. This was achieved by monitoring the mass of high quality and relevant streams we’ve bookmarked over the years, which help us stay on top of all the important trends and engage in debates and conversations while they are still ‘hot’.
Besides sharing other people’s content, we also got everyone on our team blogging more, aiming to post twice a week. With a huge number of blogs already out there, our aim was to create organic content that would be interesting and unique for our target audience. Whenever a blog was published on our site, we set up an automated email to the internal team encouraging them to share it across their personal networks.
The impact on engagement, clicks, follower recruitment and website visits from social media
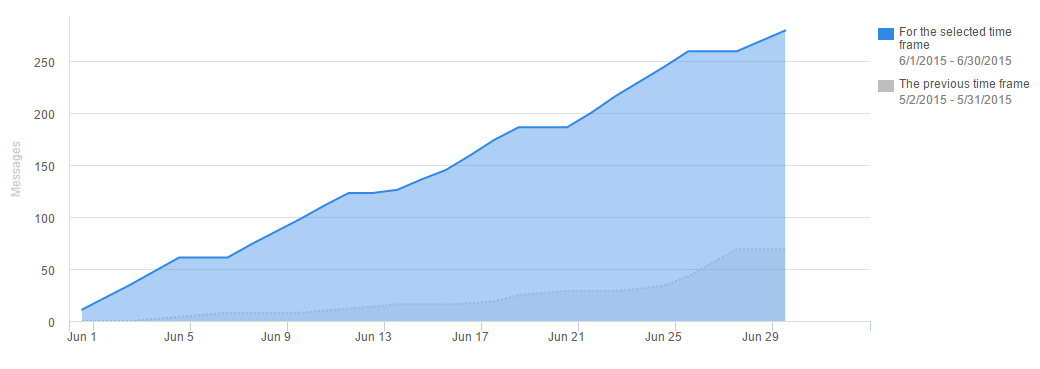
So, did it work?! In short, it was probably more effective than we ever hoped it would be! To demonstrate, we wanted to share with you some graphs obtained from our HubSpot reporting tool – after all, the proof is in the results! The June results are always in blue, whereas the same results in May are the darker blue/grey colour.
Firstly, when we talk about posting more often, what do we really mean? Well, as you can see in the graph below, we published 279 messages in the month of June (blue graph), as compared to 69 in May (grey graph) – that’s a 300% increase! These were spread across Twitter, LinkedIn, Facebook and Google+. It's also important to note that we needed to keep post quality and relevance high (so that our audience wouldn't start tuning us out!).

More posts leads to more clicks and engagement
So we published a lot more messages, but what did our followers think about that? Below, you can see that through the month of June, we gathered about 200% more clicks and 230% more interactions (mentions, replies, comments, likes, favourites and retweets) than in May. This suggests that our messages were interesting for our audience and that by posting more often, we saw an upswing in engagement.
Increased clicks (200%):

Increased interactions (230%):

Sadly, more posts didn’t lead to more followers
By boosting our social media efforts, we gained more clicks and interactions, but what about new followers? This graph shows that while we gained followers, the number of net new fans and followers in June stayed roughly the same as May. So while increasing the number of posts we send out each week drove more engagement, it didn’t attract more followers (perhaps suggesting a good future experiment/case study for us to explore).

But we did get more website visitors
One of the most important metrics we were interested in tracking was visits to our website. While engaging with our audience directly on social sites has a lot of value, ultimately, we wanted to boost website visitors. Why? Because, as marketers, we want more people to learn about us as company, find out what we do, perhaps subscribe to our newsletter and hopefully contact us to talk about their challenges (especially those we can help them solve).
Did we succeed? Well, during the month of June, visits to our website from social media increased by more than 160%. That’s considerable, as not all of our posts shared links to our website. It also indicates that the BioStrata content (mostly blogs) that we were sharing was interesting to our audience. Seeing this graph has made us realise that we need to keep the fresh content coming, and blogging for our website is something we now are continuing to scale up to help ensure website visitors continue to climb.

A note on interpreting these results
Hopefully you agree that we’ve presented some compelling data, and we can confidently claim that boosting our social media efforts triggered the increases seen in the graphs. However, given that most of our team come from a science background, you’d have to expect us to carefully analyse our data (and highlight a few caveats!), which of course we did.
Firstly, while we tried to follow the scientific method and change just one variable (the number of posts we sent out during June), in reality, there were some variables out of our control (e.g. when our audience was online to see our posts). Other variables changed throughout the experiment (e.g. as the month progressed, we could see engagement and thus got a better idea of what was resonating with our audience).
Secondly, it’s important to note that this is just a month’s worth of data. Could it be that we hit a chord with our audience during the month of June? Or maybe people were more active on social media during this time period? The only way to find out is to continue the experiment in the coming months to see if these trends are purely seasonal or a result of our new social media plan.
How you can put this information to use
So there you go folks, there’s the results of our in-house experiment. Want to know how you can achieve the same results for your business? Watch this space, a blog on exactly how we did this is already in development!
Sign up to our free monthly newsletter to be kept up to date on this and for other top tips for improving your life science marketing.