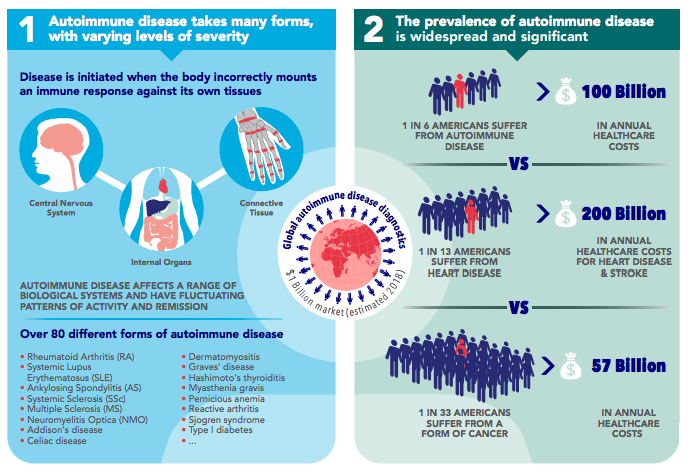
Infographics can be a powerful tool in the modern life science marketer’s toolbox. As their name suggests, infographics are pieces of content that can help convey sometimes complex or detailed content (such as data) in an attractive, impactful and manageable visual form. Used correctly, a great infographic can be an effective lead-generation tool, be utilised across a number of platforms to convey your company’s message, and speak directly to your ideal customers. Around 65% of people are visual learners, and research has shown that the brain can process and retain visual information in as little as 13 milliseconds. This makes an infographic the perfect tool to make a lasting impression on your prospects.
High-value content, like infographics, require a good amount of time and resource investment, something that is not always readily available for the busy marketing pro of today. To help, we’ve summarised some top tips on how to create the perfect infographic for use in your life science marketing programmes.
Blog snapshot: Infographics can be powerful tools to improve brand awareness, create leads and convey complex data or information in a visually impactful way. A great infographic tells a coherent story, is tailored towards your audience, and is designed to optimise engagement and reach. To help you create that perfect infographic, why not contact us to request some examples today?
Why are great infographics valuable tools in life science marketing?
For life science marketers, harnessing the power of an infographic’s visual content is a highly effective way of capturing the attention of busy prospects, who are likely to have just a matter of minutes to absorb what you’re trying to tell them.
Some key benefits of creating and sharing infographics as part of your life science marketing campaigns include:
- Long shelf-life: Your audience will spread your message by reposting infographics on their own digital and social media platforms. They may even post them on relevant sites to reach new audiences and potential customers.
- Improved brand awareness: Using promotional techniques (more on this below) will invite prospects to explore your website and company to spread the word about your brand. This is a fantastic opportunity to build credibility and demonstrate your expertise, enhancing your reputation as a thought-leader within your sector.
- Enhanced brand recall: Visuals will stay top of mind long after your prospects see your infographic—especially if they share it—so, it’s more likely they’ll think of you when making a purchasing decision.
- Lead generation: High-value content like infographics are great tools for lead generation, as they can be that downloadable asset that your prospects reallly cannot live without, and will therefore provide their contact details to get it.
It’s clear that infographics can be a powerful life science marketing tool. However, it’s important to remember that there are certain rules to follow when creating an effective infographic; no one’s going to be interested if the message is illogical, irrelevant or badly designed. Below we’ve put together three general tips on creating exceptional infographics that will help you get tangible business results.
Tip 1: Tell a logical and coherent story
Like all content, your infographic should have a beginning, middle and end, and flow in a way that helps your audience understand its message. Too often we see graphical content that is just a brain-dump of information or data surrounded by a blur of colour. This just counteracts the infographic’s best feature; its ability to convey complex data in a concise and logical way. You have to ensure your infographic really tells a clear story. It may help to start by creating an outline that maps out the key ideas and points you want to get across in a visual form—which will help ensure the information flows logically and makes it fun and easy to follow.
As you might expect, it’s worthwhile starting with a title that grabs your audience’s attention. In this instance, it could help to take a buyer persona-driven approach to your content strategy, so you know what kind of language speaks to your ideal customer’s challenges. Next, you can begin building out the main body of the infographic, making each stage progressively more complex, building to a conclusion that connects everything together.
It’s important to remember to base the key messages of your story on crucial scientific details, facts, and/or statistics to make it credible and valuable to your audience. So, take the time to really dig deep into the subject and find reliable data with links to your sources. Although you needn’t shy away from complex ideas and information, it’s worth using simple, clear and concise explanations to keep your reader engaged and interested.
Tip 2: Create something visually stunning, tailored to your audience
Great design underpins every engaging and successful infographic, so it’s crucial to get this right. Your first step should be to define who you’re targeting (as mentioned above, use your buyer personas) and why your infographic is going to benefit them. For example, are your prospects old or young, experienced or new to the life sciences, experts or non-specialists? Will they benefit most from data-heavy figures or compelling, unique visuals? Are they averse to the colour fluorescent pink? And so on.
Pick the most appropriate data visualisation by deciding what’s most sensible and effective at illustrating your key facts and figures to your audience. For instance, does a pie chart or a bar chart best illustrate your story about the top 10 life science automation technologies of 2017? And it’s important to remember the adage “less is more” here; use uncomplicated graphics, ensure there’s enough ‘whitespace’, limit the amount of text, and keep different fonts and colours you use to a minimum.
The design techniques you use can depend entirely on what you’re trying to communicate, but applying some general design principles can be helpful to ensure your infographic appeals visually to your readers, and doesn’t create a negative brand perception.
For example, it may be worth pairing each stage of your story with an image to anchor and explain a particular section, and using clear markers (such as bullets or numbers) can help to emphasize the logical order of the steps in your story. A good colour scheme (limited to two to three complementary colours at most) will make your data pop and grab your audience’s attention. It’s also important to use consistent spacing, as this will help the viewer’s eye absorb each and every last element of your infographic in the time it takes to blink.

The last thing to point out is that your infographic will be viewed on a range of different devices and platforms. This means it’s important to remember to design it so that it looks great however it’s viewed. The ideal resolution is 72dpi for web, 150dpi for retina screens, and 300dpi for print (and remember that colour formats should be RGB for web, and CYMK for print). Also, consider that different social media platforms display different dimensions, so you may need to edit your infographic to optimise viewing on different channels. Remember, depending on who you are targeting, you will need to consider different communication preferences with some users preferring to view content on a desktop or laptop, and others being mobile-first.
Tip 3: Optimise engagement and reach
Once you’ve created your data-driven and beautifully designed infographic that's tailored to your audience, it’s vital to check and double-check for errors. Once it’s out in the big wide world and being shared online, it’ll be close to impossible to recall. Protect your brand’s credibility and professionalism by performing careful quality control of figures, source lines and text. And always remember to include your own URL on the infographic, giving prospects the opportunity to take that next step and visit your website.
Next up, it’s important to use the power of promotion to drive attention to your infographic and interest in your brand/offering. Utilise your social media channels to get your content out there, and be sure to include embed codes so your infographic can be easily shared on social media and on other websites and blogs. Instead of just presenting your infographic on social media so anyone can freely download it, why not try gating it behind a lead capture form on an equally-effective landing page? That way, you can use it as a conversion mechanism turning your ideal customers into leads.
You can also consider including an additional call to action (CTA) on the infographic itself to further drive traffic to your website (and other relevant channels) to make the most out of its long shelf life. Additionally, why not break up your content into snackable sizes and teaser images for extended social sharing, giving your infographic the opportunity it deserves to reach as many prospects as possible?
Should infographics form part of your life science content strategy?
Infographics can undoubtedly be an effective tool for the modern life science marketing pro. By grabbing the attention of your ideal customers with compelling visuals, and communicating key messages in the blink of an eye, you can engage with busy scientists as well as reach prospects who may not be responsive to other marketing techniques. Infographics allow you to control how and what you communicate over a prolonged period, enabling you to continuously improve awareness and recall of your brand, and ultimately drive traffic to your website to generate leads and potentially new customers.
BioStrata has helped develop many infographics for its clients in the past. If you would like to see some examples of how complex data can be presented in a new and creative manner, then why not contact us today?


